


Visualization and animation of a 3D regional velocity model
Bohuslav Ruzek 1, Karel Holub 2, Jana Rusajova 2, Jan Lemka 3
1 Geophysical Institute AS CR, Prague 2 Institute of Geonics AS CR, Ostrava 3 VSB-Technical University of Ostrava, Faculty of Civil Engineering
This web page is one part of a presentation of results of the geophysical research based on the original paper by Ruzek et al. (2011) related to application of seismic tomography. Our approach has currently been aimed at the visualization and animation of the model derived by means of seismic tomography.
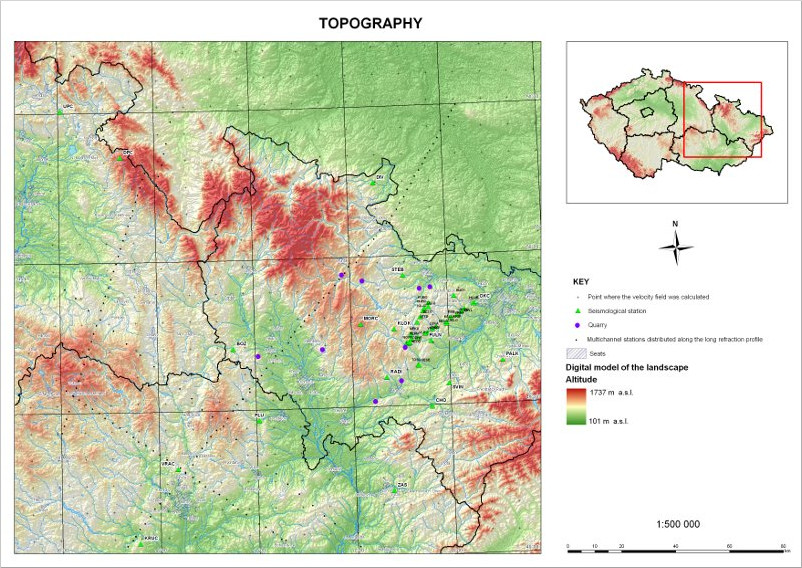

Except for shot-hole explosions along the international and regional refraction profiles, quarry blasts and mining induced seismic events, 43 local tectonic events were recorded and localized as well. Almost 1/3 of all these events create a cluster, in oval shape with axes roughly 15 km and 5 km long, the remaining epicentres spread irregularly over the territory of northern Moravia and Silesia. This focal region was situated NNE from the town of Olomouc. According to the geological survey, no demonstrable tectonic fault generating these tectonic events has been proven there, and if it does exist, it is covered by alluvium. The occurrence of these microearthquakes had, from time to time, a less numerous swarm-like character.The distribution of all microearthquake epicentres is displayed in Fig. 2, and corresponding source parameters are presented in Table
| Nr. | φ | λ | Z [km] | RMS [s] | n | Date | Time |
|---|---|---|---|---|---|---|---|
| 0 | 49.853 | 17.824 | -9.7 | 0.108 | 12 | 15/07/2003 | 16:57:37.876 |
| 1 | 49.763 | 17.363 | -19.0 | 0.164 | 12 | 16/07/2003 | 01:01:48.573 |
| 2 | 49.966 | 17.983 | -7.6 | 0.428 | 5 | 16/08/2003 | 01:50:55.462 |
| 3 | 49.736 | 17.988 | -19.9 | 0.192 | 10 | 24/10/2003 | 19:41:27.838 |
| 4 | 49.727 | 16.909 | -3.0 | 0.191 | 14 | 24/11/2003 | 11:48:28.915 |
| 5 | 50.425 | 16.083 | -7.8 | 0.346 | 14 | 04/12/2003 | 23:47:19.192 |
| 6 | 49.685 | 17.805 | -13.0 | 0.257 | 9 | 23/03/2004 | 10:38:32.951 |
| 7 | 49.304 | 17.835 | -22.9 | 0.185 | 6 | 26/03/2004 | 08:36:26.044 |
| 8 | 49.280 | 17.827 | -13.2 | 0.194 | 12 | 26/03/2004 | 11:08:54.469 |
| 9 | 49.338 | 17.816 | -26.2 | 0.165 | 12 | 10/04/2004 | 06:35:59.069 |
| 10 | 49.852 | 17.828 | -9.7 | 0.111 | 7 | 21/04/2004 | 04:09:02.785 |
| 11 | 49.718 | 17.986 | -18.1 | 0.386 | 15 | 01/05/2004 | 00:00:52.033 |
| 12 | 49.996 | 16.876 | -14.3 | 0.292 | 19 | 28/05/2004 | 17:01:14.137 |
| 13 | 49.738 | 17.671 | -14.1 | 0.347 | 15 | 04/06/2004 | 00:20:00.874 |
| 14 | 49.741 | 17.678 | -17.0 | 0.345 | 23 | 06/06/2004 | 06:44:46.597 |
| 15 | 49.577 | 17.852 | -15.5 | 0.182 | 9 | 20/08/2004 | 11:40:42.270 |
| 16 | 49.576 | 17.852 | -18.0 | 0.289 | 9 | 20/08/2004 | 20:04:46.984 |
| 17 | 49.645 | 17.818 | -14.7 | 0.079 | 12 | 20/08/2005 | 19:07:25.740 |
| 18 | 49.649 | 17.816 | -12.5 | 0.279 | 8 | 25/08/2005 | 10:55:07.617 |
| 19 | 49.878 | 17.856 | -10.9 | 0.075 | 5 | 07/09/2005 | 18:01:04.704 |
| 20 | 49.675 | 17.134 | -2.5 | 0.421 | 13 | 12/10/2008 | 08:57:06.045 |
| 21 | 49.373 | 17.330 | -14.1 | 0.119 | 6 | 18/10/2008 | 15:50:01.624 |
| 22 | 49.652 | 17.282 | -7.5 | 0.087 | 6 | 25/10/2008 | 20:17:32.811 |
| 23 | 49.632 | 17.287 | 0.0 | 0.046 | 6 | 26/10/2008 | 00:31:34.854 |
| 24 | 49.683 | 17.266 | -1.0 | 0.444 | 11 | 26/10/2008 | 02:43:26.285 |
| 25 | 49.663 | 17.292 | -10.8 | 0.056 | 7 | 26/10/2008 | 05:40:44.821 |
| 26 | 49.706 | 17.244 | -1.4 | 0.414 | 13 | 26/10/2008 | 22:30:10.891 |
| 27 | 49.638 | 17.307 | -10.8 | 0.176 | 10 | 28/10/2008 | 22:31:55.283 |
| 28 | 49.628 | 17.296 | -6.1 | 0.164 | 7 | 31/10/2008 | 03:36:20.627 |
| 29 | 49.624 | 17.300 | -5.9 | 0.166 | 6 | 12/12/2008 | 03:09:00.645 |
| 30 | 49.662 | 17.309 | -13.5 | 0.304 | 11 | 22/12/2008 | 00:45:03.539 |
| 31 | 49.672 | 17.283 | -12.7 | 0.292 | 13 | 25/12/2008 | 09:36:30.753 |
| 32 | 49.649 | 17.320 | -12.4 | 0.067 | 6 | 01/01/2009 | 22:53:25.105 |
| 33 | 49.638 | 17.306 | -8.3 | 0.349 | 8 | 10/01/2009 | 04:24:08.022 |
| 34 | 49.751 | 17.245 | -9.1 | 0.054 | 6 | 05/02/2009 | 05:59:28.966 |
| 35 | 49.642 | 17.278 | -6.6 | 0.136 | 6 | 15/02/2009 | 17:32:25.907 |
| 36 | 49.659 | 17.272 | -4.8 | 0.268 | 11 | 08/03/2009 | 23:55:36.251 |
| 37 | 49.650 | 17.278 | -3.3 | 0.238 | 8 | 15/03/2009 | 14:03:58.742 |
| 38 | 49.616 | 17.315 | -8.8 | 0.353 | 8 | 26/03/2009 | 15:40:22.394 |
| 39 | 49.665 | 17.257 | -5.3 | 0.392 | 17 | 28/03/2009 | 06:37:44.351 |
| 40 | 49.942 | 17.883 | 0.0 | 0.308 | 9 | 29/03/2009 | 10:20:29.860 |
| 41 | 49.935 | 17.926 | -11.9 | 0.037 | 5 | 29/03/2009 | 11:01:30.244 |
| 42 | 49.630 | 17.315 | -6.9 | 0.225 | 8 | 23/04/2009 | 22:02:10.001 |
The first phase of the three-dimensional modelling using seismic tomography is illustrated in Fig. 3, where the individual coloured circles within the process of data featuring substitute the basic structural rectangular elements, dimensions 5x5x2 km. Since also invalid elementary boxes appeared, i.e. boxes which are not crossed by seismic rays, during the velocity approximations, they had to be eliminated by binary masking. It is worthwhile mentioning that for masking all values were divided into two categories, namely 0-0.01 valid for data without a predicative value based on the measurement, and category 0.01-10 for data verified by measurements.
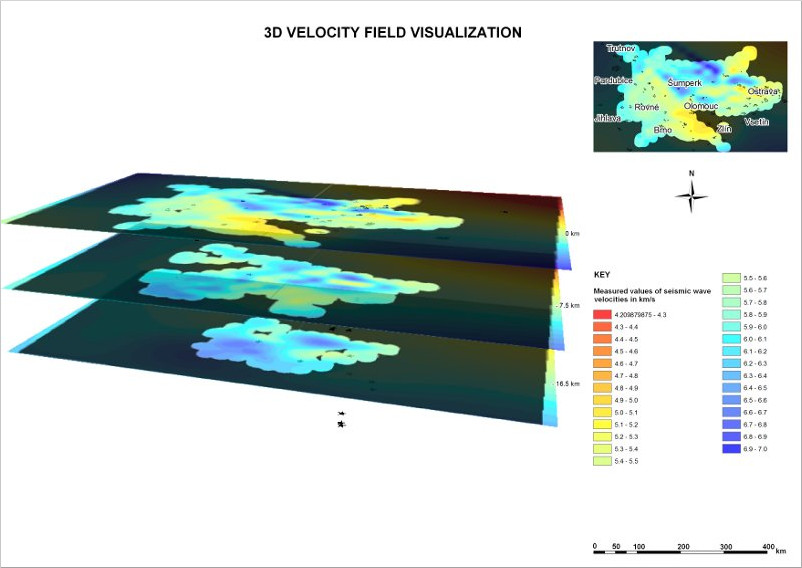
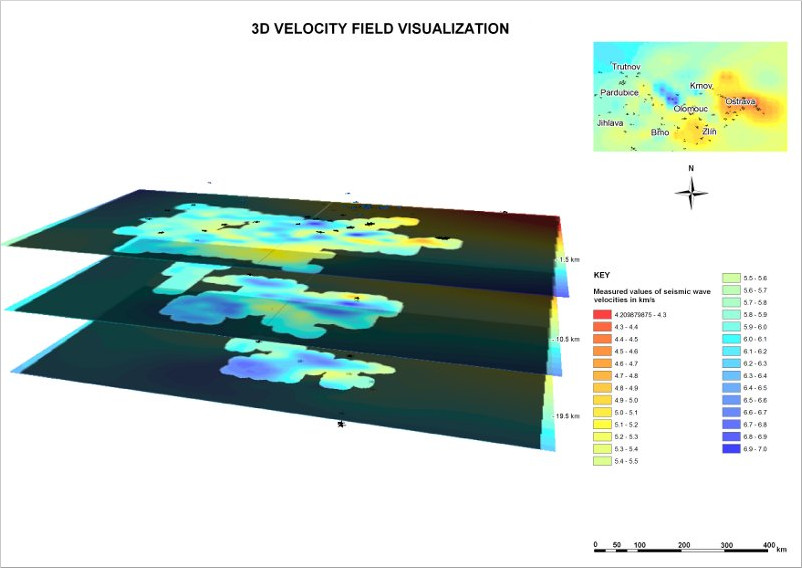
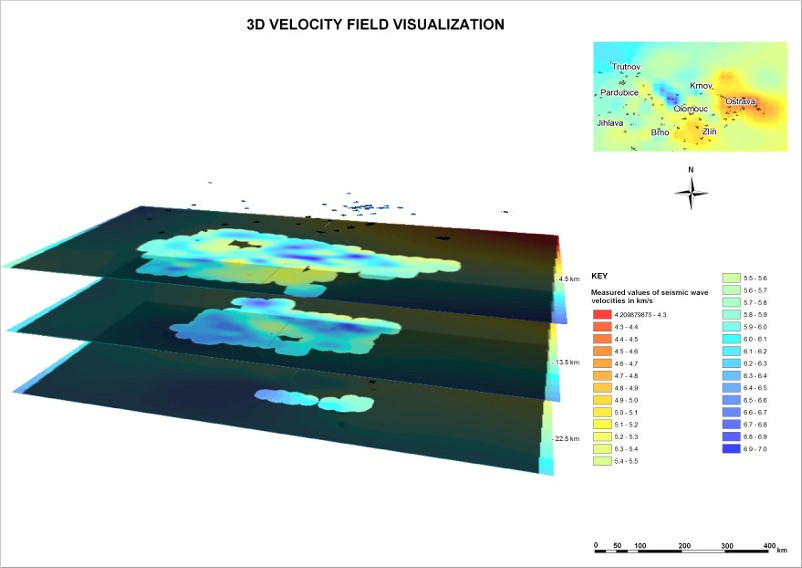
In principle, 3D data visualization and animation have been based on the application of data transformation and utilizing various procedures and special programs, e.g., ESRI ArcGIS Desktop 9.3, ArcMap, ArcCatalog, ArcScene. The resulting models presented in Figs 4, 5 and 6 have been successively transposed to the format of VRML (Virtual Reality Model Language) which in case of using, e.g., program Cortona 3D, is a plug-in for Internet browsers MSIE, Netscape and Mozilla. The Cortona 3D program then enable three dimensional objects to be browsed on web pages and, moreower, it is possible to change viewing angle and rotate the object. We refer the reader to detection and downloading of the VRML plug-in for the individual OS.
References
- B. Ruzek, K. Holub, J. Rusajova: Three-dimensional crustal model of the Moravo-Silesian region obtained from seismic tomography. Studia Geophys. Geod., Vol. 55, 2011, pp. 87-107.